
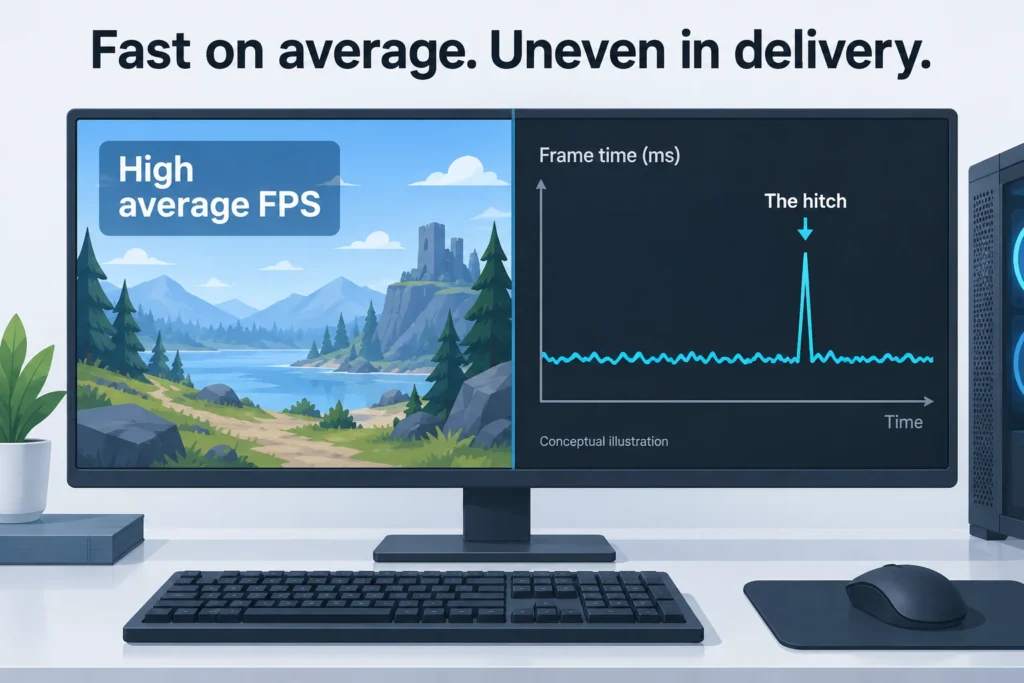
The PC can produce a lot of frames overall, but can take too long to produce the next one. Average FPS hides uneven spacing. I would look at frame-time for the stutters, do repeated runs of the test, not lower all the graphics settings, or assume an upgrade to a faster GPU is needed.
120 FPS can still contain a conspicuous pause
Consider two invented one-second sequences. In the first, 120 frame intervals each last about 8.33 milliseconds. The second has 119 intervals of 8 ms, with the last being of 48 ms. (119 × 8) + 48 = 1,000 ms. Both sequences represent delivery of 120 frames in one second. But the second includes a gap almost six times the evenly spaced interval. The average has lied; it has answered the wrong question.
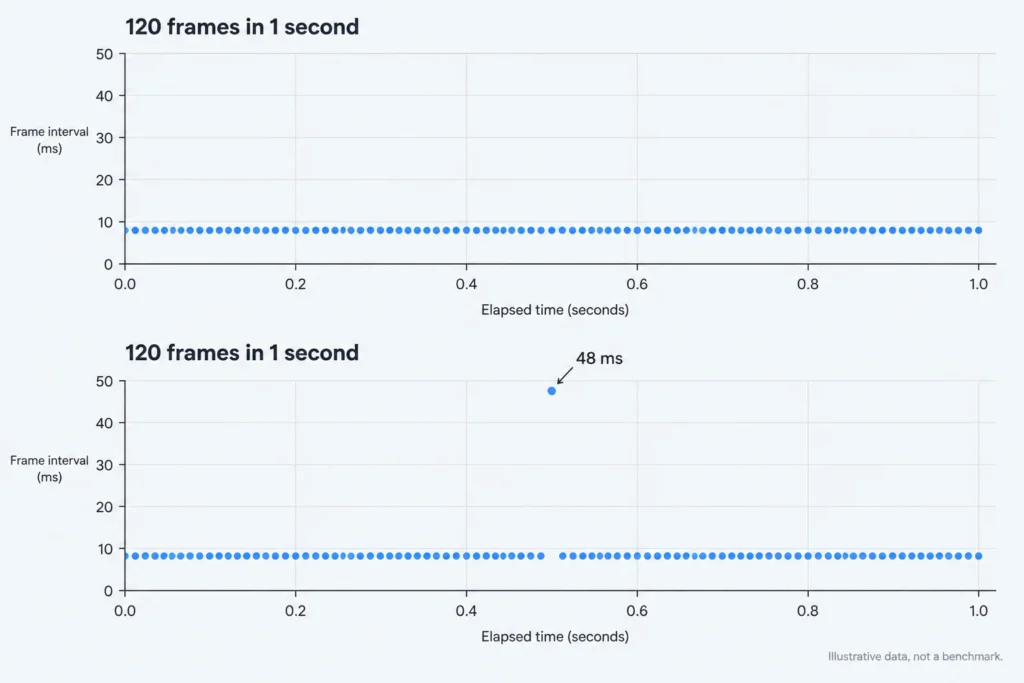
Imagine I am about to jump, and my frame counter is happily reporting 120 FPS. The camera hangs just as I turn to jump, and I miss the landing. After all that, I am frustrated enough to consider lowering my settings, but I don’t. I need to show you that, and not the average that was impressed throughout.
To see this, you can look at a frame-time graph, where 60 FPS corresponds to about 16.67 ms, and 120 FPS to about 8.33 ms. Neither is a hard cutoff for stutters. Look at frame intervals that surround the long interval, and see if it correlates with how you felt. An even a 1% low summary will not tell you where that interval occurred.
Record the pause, not just the counter
I’d go for capturing the annoying door way or fight, rather than capturing the entire evening, then having to search for the pause to look for. Use a per-frame capture tool like Intel PresentMon, select your game process, and do a short capture, say a minute, at the approximate time of the event. Capture individual frames, not averages, and don't make any changes to the monitoring set up between captures. Another overlay is yet another variable.
There's one naming trap you'll want to avoid before looking at the graph. PresentMon’s Frame Time is the time it takes for an application to generate a frame. Displayed Frame Time is the time it takes for a frame to be updated and shown to the user. GPU Busy is how long it takes for the GPU to finish it’s work, and is not necessarily the total time it takes to do that work. Those are all different portions of a delivery, and none of those necessarily means it’s capturing the total amount of time it takes for your input to be shown on the screen.
Use your defined metric frames, and don't change anything between runs. If it's making frames that are generated and frames that are shown to the user hard to distinguish, capture a comparison with it disabled. Capture a comparison disabled, not because disabling it is a guaranteed solution, but because you need to know which frames you’re comparing.
What stops moving matters, too. A camera or whole-image hitch that lines up with a timing spike points toward local frame delivery. Other players snapping backward while your camera stays smooth points more toward a network correction. Look at the game’s network display at that moment: ping measures round-trip delay, packet loss measures failed delivery, and jitter measures variation in ping. A healthy average ping can hide interruptions just as a healthy FPS average can hide a pause.
An offline mode can help, but I wouldn’t treat it as a perfect networking test: different player counts, AI, maps, or simulation load may change the workload. Stable frame delivery alongside network disturbances supports investigating the connection without identifying the faulty router, server, or hop. Both problems can coexist. And if motion looks uneven despite a smooth application trace, check displayed timing before ruling out local delivery.
Give the unchanged game a second chance
Conduct a few normal, unchanged runs first. Record the route, and repeat it a few times with the same save, camera movement, and resolution as closely as possible. Repeated runs help determine how much the game naturally changes. To check if your changes are truly impacting the game, you need to do a 'warm-up' first.
The absence of pauses does ease concerns, but it’s not a diagnosis for shaders. There are other issues that can cause first-encounter hitches, such as asset caches, compilation and warm-up of shaders and pipelines. Epic Games provides documentation for traversal-related loading, spawning and streaming in Unreal Engine. Hitching on every warmed-up pass makes us suspect that recurring traversal work is the issue, not first-encounter work. This doesn’t tell us which work (traversal or otherwise) caused the stall.
In general, I wouldn’t recommend deleting shader caches. NVIDIA states that first-run stutters can occur after a driver install and that caches are reset for reuse. Epic’s suggestion of clearing caches is for developers, not player maintenance. You might want to clear your caches between runs.
Change one thing that could explain the hitch
Test only one variation at a time and repeat route to adjust back to the original condition. The last comparison is important, an unrelated adjustment can appear to be a huge improvement because of warmed caches.
| Comparison | Useful observation | What it doesn’t prove |
|---|---|---|
| Lower render resolution; leave other settings alone | The same warmed-up spikes shrink repeatedly: rendering load may contribute | A higher average alone doesn’t explain an unchanged hitch |
| Try a lower, sustainable frame cap | Delivery becomes more consistent under the same workload | The cap hasn’t necessarily fixed compilation or loading stalls |
| Pause a download or sync job; close one optional capture tool | Spikes improve while that activity is absent and return when restored | One smoother pass doesn’t establish background interference |
| Lower texture quality when memory pressure is suspected | The troublesome route repeatedly improves | An allocation reading near VRAM capacity alone doesn’t prove harmful paging |
Repeat the activity causing the hitches and compare with security protection enabled. If a scheduled scan occurs during the hitches, compare after the scan to disable protection. You can see activity of individual background tasks in Task Manager. I’d want the hitch to improve with activity and return with it before I could blame the task.
Compare after scheduled scans and after other tasks that occur during hitches.
Utilization readings are useful clues, but poor shopping advice on their own. Total CPU use can hide a busy thread, and GPU use can drop because the GPU is waiting for work. High GPU use may explain sustained rendering load without explaining that one isolated pause.
The same caution applies to storage and memory: disk activity might be game loading or another process, while an allocation figure near VRAM capacity doesn’t establish harmful paging. Microsoft and Intel’s profiling documentation separates execution, waits, file access, and memory behavior because those distinctions change the diagnosis. Your overlay may also sample too slowly to catch the brief event. Use its readings to choose a comparison, not to declare a component guilty.
What would justify a settings change, or a purchase?
Keep a settings change when it repeatedly reduces the relevant spikes by more than the variation between unchanged runs, and the visual tradeoff is acceptable to you. If resolution drops raise average FPS but leave the same pause intact, I’d put the image quality back. You haven’t bought smoothness with that sacrifice.
If one game keeps hitching at the same event despite warm runs and targeted comparisons, look for developer known-issue notes for that exact title and build. A report with the route, settings, hardware, and timing record gives the developer something more useful than “120 FPS feels bad.” This pattern doesn’t prove an engine bug, but some stalls need a game-side change. I wouldn’t keep stripping away image quality when the pause refuses to change.
A GPU that’s consistently high load while game rendering stalls supports considering a better GPU. While a CPU is largely idle during the game, high usage during game rendering stalls supports considering an upgrade. An SSD or more RAM supports a case for stall because of loading, not just a spike in an activity or near maximum allocation.
Without your game, configurations and traces, I can’t name the limiting part. Before you spend, consider which paused game activity would this shorten, and why?
Sources and references
- Intel / GameTechDev: PresentMon Capture Application documentation
- Epic Games: Game engines and shader stuttering: Unreal Engine's solution to the problem (2025-02-04)
- NVIDIA: Manage 3D Settings reference
- Microsoft: Profile the CPU and GPU with timing captures
- Electronic Arts: EA SPORTS FC Connection Quality explained
- Intel: Identify Issues in Graphics Application Execution with Trace Analyzer